Bond Prices
To live like James Bond, you need a lot of money. An Aston Martin is not cheap, and neither are luxury rendezvous.
We’re not, however, writing about the price of being a Bond, but about bond prices. And while they may be less exciting, they can be more lucrative.
While the value of a bond represents the money lent or borrowed, it's quoted as a percentage of its par value. For example, if you lend $1,000 and the bond trades at par, it will be quoted at 100, which means it’s trading at 100% of its par value.
Now, bonds are publicly traded securities, so their prices fluctuate due to shifts in supply and demand. And if you’re unfamiliar, bond prices move inversely to interest rates.
So, if interest rates rise and a bond’s price falls, it could be quoted at 98, which means it’s trading at 98% of its par value. Conversely, lower interest rates could push the price up to 102, which means it’s trading at 102% of its part value.
Several factors impact bond prices – including credit spreads, term premiums, liquidity premiums, geopolitical concerns, and other economic issues. However, the net effect is a higher or lower interest rate, which results in a lower or higher price.
The reason bond prices move inversely to interest rates is the effect of new issuances. When interest rates rise, new bonds have higher yields, which means old bonds need to be re-priced to match the higher yield. Therefore, if a new 100 bond has a 5% yield, an old bond with a 4% yield needs to decline to 99 to provide investors with the same 5% return.
But remember, the 5% return on the 99 bond is a function of the 4% yield (which always stays the same) and the 1% capital gain that results from the bond price increasing from 99 to 100 at maturity.
Bond Prices and Gold
While bond prices and interest rates are compelling in isolation, we’re more concerned about their impact on gold. And unless a geopolitical event splinters the relationship, gold tends to cheer higher bond prices (lower interest rates) and jeer lower bond prices (higher interest rates).
This occurs because lower interest rates make gold more attractive. Since the noble metal is a non-yielding asset, declining rates reduce the opportunity costs of holding gold. Moreover, when inflation expectations exceed nominal interest rates, bond investors earn a negative real yield, which is less than the theoretical return expected from gold. Conversely, if nominal interest rates exceed inflation expectations, positive real yields reign, and bonds should earn a higher return.
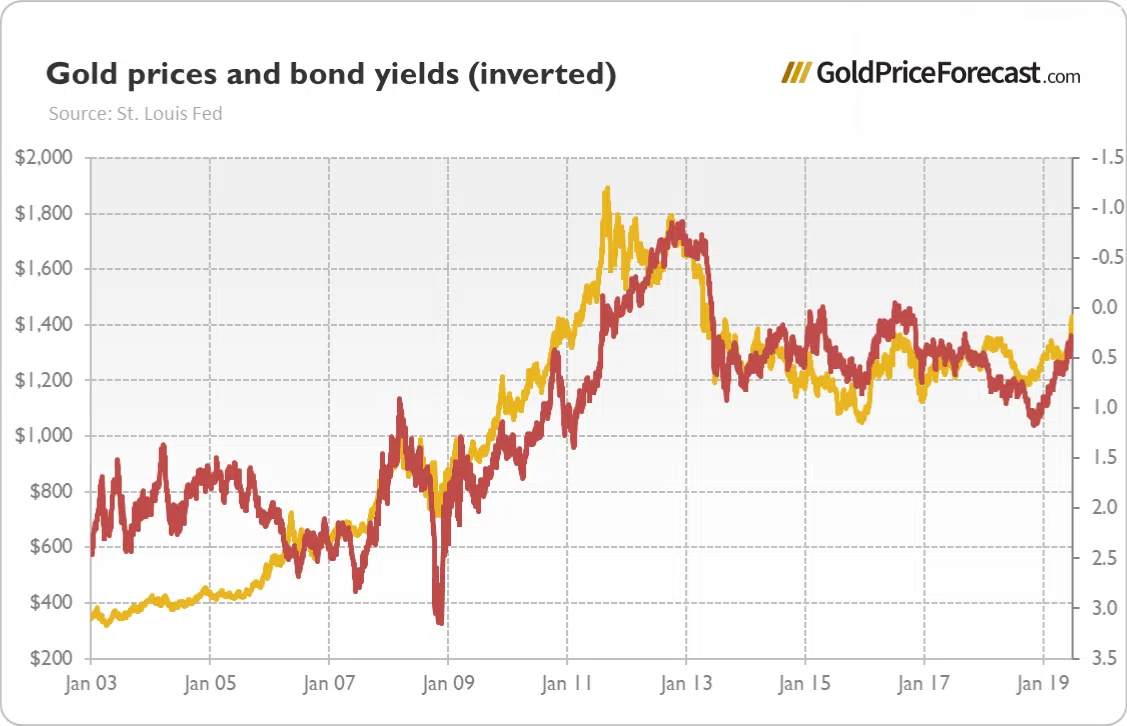
If you analyze the chart below, you can see there is a clear negative correlation between the gold price and real yields, which suggests that real interest rates heavily influence gold.
Chart 1: Gold prices (yellow line, left scale, London P.M. Fix, in $) and the bond yields (red line, right axis, 10-year US Treasuries indexed by inflation, in %) from January 2003 to July 2019.

For a greater visual effect, we inverted the bond yields’ scale (down means up) to show how both lines are highly connected, which reflects a strong negative correlation.
Chart 2: Gold prices (yellow line, left scale, London P.M. Fix, in $) and the bond yields inverted (red line, right axis, 10-year US Treasuries indexed by inflation, in %) from January 2003 to July 2019.
Bond Prices and Silver
Despite the strong correlation between gold and silver, the latter is somewhat less affected by the movement of real interest rates. The chart below shows how silver can ignore real yields for brief periods.
However, short-term breakdowns in correlations are common for many assets, and that’s why you can’t rely on a single indicator to predict the PMs’ future paths. In reality, you must assess several technical and fundamental metrics to achieve the best results.
Chart 3: Silver prices (blue line, left scale, London Fix, in $) and the bond yields (red line, right axis, 10-year US Treasuries indexed by inflation, in %) from January 2003 to July 2019.

To further illustrate the point, we once again inverted the bond yields’ scale (down means up). As you can see, the pair are less aligned than in the gold example, which reflects a weaker correlation.
Chart 4: Silver prices (blue line, left scale, London Fix, in $) and the bond yields inverted (red line, right axis, 10-year US Treasuries indexed by inflation, in %) from January 2003 to July 2019.

Where Are Bond Prices Headed?
To determine price targets for gold, silver, and mining stocks, we use a multitude of indicators. And within our toolkit, bond prices and yields are important variables. More specifically, real interest rates not only impact the PMs, but they also affect the multiples on traditional stocks and the value of cyclical commodities, like copper and oil. Consequently, you must monitor real yields to avoid unwanted surprises.
Our premium alerts cover these concepts in great detail, and you can sign up for a free seven-day trial to see for yourself. Each subscription includes access to our Golden Meadow platform, where you can interact with other members and our team of analysts.
You can also sign up for our mailing list and receive free daily content along with timely promotional offers.