Gold price likely reached its upside target, and the top is in. Yes, you read that right.
And yes – this creates a bearish forecast of gold prices for October 2024.
I previously wrote that the yellow metal’s upside target is at about $2,730, but as I double-checked the upside target based on the same technique (Fibonacci extension based on gold’s previous rally) but while using different chart provider, it turned out that the upside target was actually lower – very close to the $2,700 level.
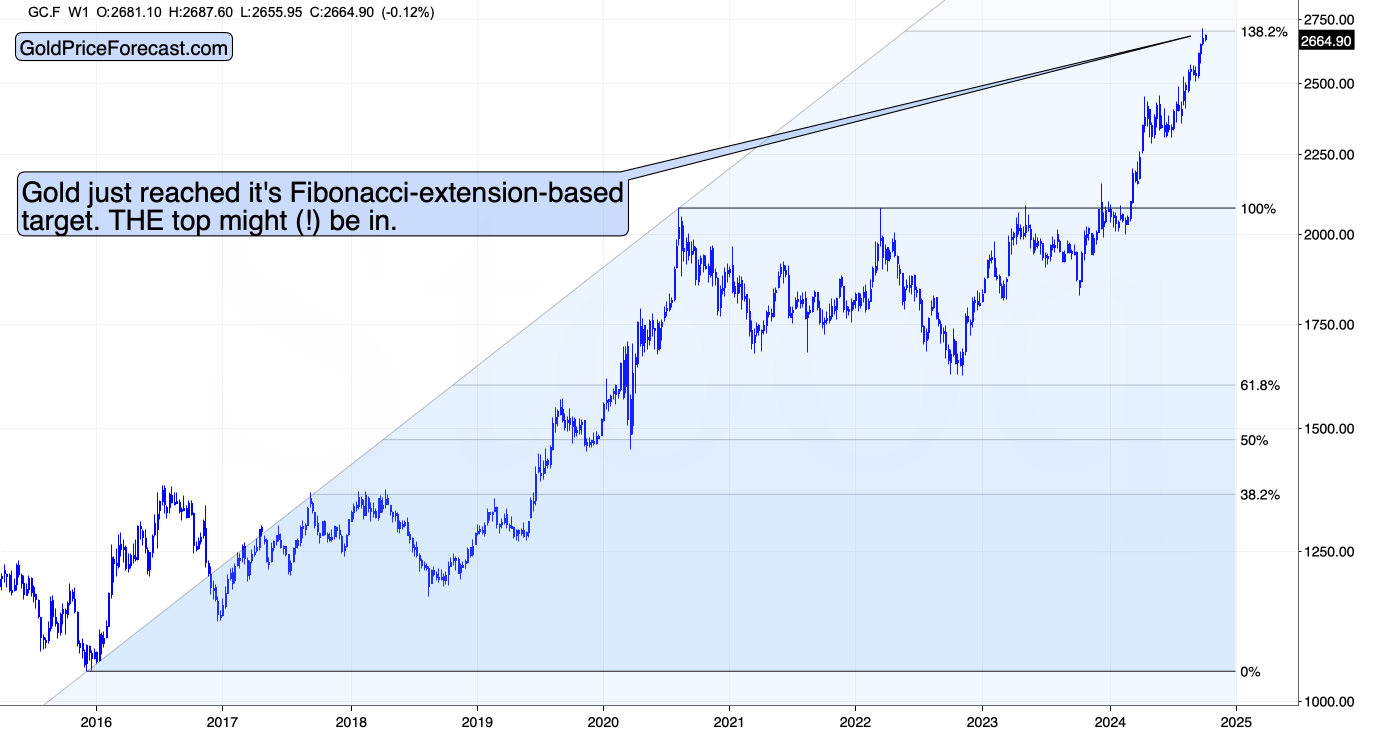
The tops were connected to the Fibonacci tool very precisely, and it turns out that gold not only reached its upside target, but it even moved slightly above it and then moved back down in a clear manner.
Gold price even formed a weekly shooting star candlestick, which is a reversal sign that supports the bearish forecast. We saw this candlestick previously and it was able to generate just a small move lower then, but this time IS different, precisely because of the target that was reached.
Gold Price Prediction for Oct. 2024 – The Short-term View
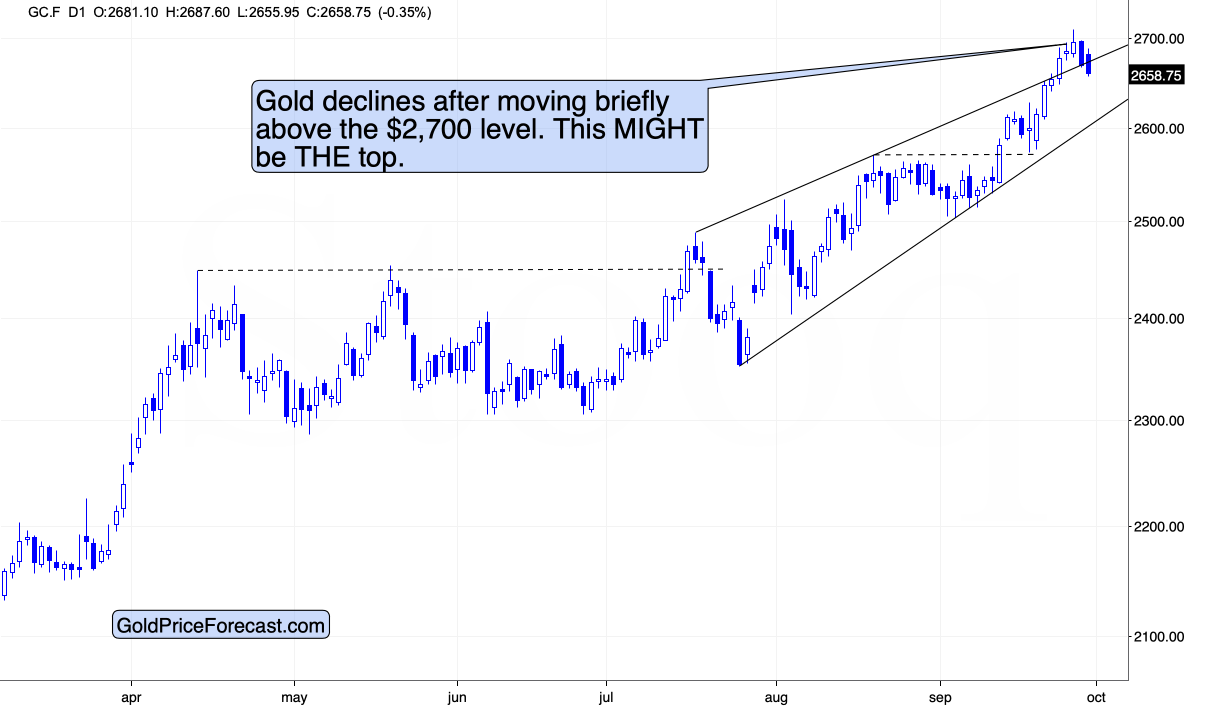
On a short-term basis, gold invalidated the move above its rising support/resistance line, which serves as a bearish confirmation.
The confirmed breakdown below $2,600 (the lower border of the rising wedge pattern) will serve as the final bearish confirmation. Since the USD Index hasn’t started its rally yet, it’s quite likely that we’ll see a major (and sharp) move lower in gold’s price once the USD Index’s rally finally starts.
Why? Because the gold price likely did what it was likely to do based on emotional (=technical) reasons – it moved to its upside target. It’s now declining without USD’s help, suggesting that gold’s “own” reasons for rallying have played out (and they are gone). Gold price now appears to be in the decline mode, and a move higher in the USD – the currency it’s generally priced in is most likely going to cause the decline to accelerate.

The U.S. currency has been moving back and forth close to the previous lows for some time now – invalidating each attempt to break below them. Each invalidation was a buy signal. It seems only a matter of time when the rally follows and since the USD Index tends to reverse its course close to the turn of the month – and today is the last day of September), it seems that we might see the rally any day (or hour) now.
As I wrote above, this would be likely to contribute to gold’s, silver’s and mining stocks’ bearish outlook.

Speaking of silver, please note that the white metal – known for fake breakouts – just invalidated its intraday breakout. This happened shortly after the session during which it outperformed gold on a very short-term basis, so we have a combination of both events that usually take place before declines.
Gold Mining Stocks Confirm the Bearish Price Prediction
And while we’re at the topic of invalidations, we saw a major one in case of the junior mining stocks.

After briefly moving above the $50 level and the 2022 high, the GDXJ quickly moved back below both and closed the week there – at $49.62.
This is a clear invalidation – and a clear sell signal.
I know it’s easy to be bullish after a quick rally, but in case of investing and trading, it is often the difficult that turns out to be profitable. It’s not an investment advice for anyone in particular – just my general opinion: if I wasn’t positioned to gain from declining junior mining stock prices, I would be entering short positions in them now.
Junior miners are likely to decline more than gold or silver, as they are likely to decline based on both: declining gold, and declining stock market values. Not just U.S. stocks, but for world stocks in general.
For example, here’s a really important clue for stock owners – and pretty much everyone else.

The NIKKEI 225 Index just invalidated (for the third time) its move above the previous all-time high.
This is a strong sign suggesting that the relief rally is over and that the top is in.
It might not be visible on the above chart because it encompasses over 30 years, but the previous invalidations took place in April, and mid-July. This is when we saw previous tops in the GDXJ – I marked that on the previous chart. That’s yet another reason to think that much lower junior prices are to be expected.
This is in perfect tune with what the copper market just indicated.

Copper just moved above its 61.8% Fibonacci retracement and its July high and it quickly invalidated this move, by creating a clear shooting star pattern.
This indicates that the top is in – quite likely not just for copper, but for other commodities (and perhaps stocks) as well. Consequently, the price prediction for gold in October 2024 is bearish.
Thank you for reading my today’s free analysis. Its full version – the Gold Trading Alert – also includes the short-term details that traders would find particularly useful. If you’d like to get those details (along with profit-take levels for our positions), I encourage you to become our subscriber today. Alternatively, if you’re not ready to subscribe yet, I encourage you to sign up for my free gold newsletter today.
Thank you.
Przemyslaw K. Radomski, CFA
Founder, Editor-in-chief