Is today’s slide in silver’s telling us something important?
Gold briefly surged to $3,065 today before retreating about $20, continuing its post-Fed decision volatility. While this move might excite bulls, several technical warning signs suggest caution is warranted as we may be witnessing what market technicians call a "bull trap" - a final surge before a potential reversal.
The recent price action in precious metals, copper, and related markets deserves careful examination, especially in the context of yesterday's Federal Reserve decision and broader market dynamics.
Fed Decision: Stagflation Signals Beneath the Surface
The Fed maintained its forecast for two rate cuts this year, initially sparking optimism across markets. However, looking deeper into the details reveals potentially troubling developments:
- Inflation expectations were revised upward (to 2.8% from previous 2.5%)
- Growth forecasts were simultaneously lowered
- The combination points toward stagflationary pressures - typically a challenging environment for most asset classes
While Powell's comments that inflation impacts from tariffs will likely be "transitory" helped boost markets initially, the Fed's actual projections tell a different story. This discrepancy between reassuring words and concerning forecasts often precedes significant market adjustments.
Gold's $3,000 Battle Continues
Gold's struggle around the psychologically important $3,000 level continues to mirror what we saw in 2011 near the $2,000 mark. The brief push above $3,050 without sustained follow-through suggests potential resistance at these levels.
What makes this particularly interesting is the timing. With uncertainty now declining after the FOMC decision, we're entering that period where markets often show their true colors.
The Warning Signs from Mining Stocks
Perhaps the most telling signal comes from mining stocks, which continue to show significant weakness compared to gold - a classic warning sign that has preceded major sector corrections throughout market history.

The junior miners ETF (GDXJ) has failed to exceed its late-2020 highs despite gold making new all-time records. This divergence has historically been one of the most reliable precursors to precious metals corrections.
This pattern of mining stock underperformance relative to gold indicates smart money positioning ahead of a potential trend change in the broader precious metals complex.
Copper's Late-Stage Rally: Historical Pattern Recognition
Copper's move toward previous highs deserves special attention as it fits a classic market pattern. Laggards catching up at major market tops is one of the most reliable signals in market history - it typically indicates that institutional investors have already positioned themselves while retail investors are just getting excited.
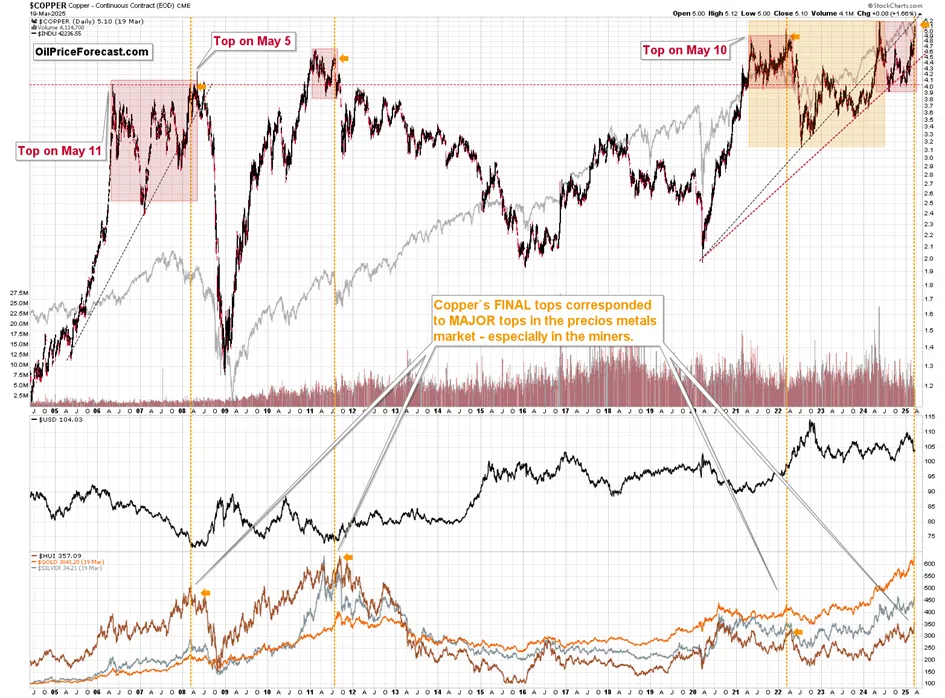
The copper chart currently shows potential formation of a double top, similar to patterns that preceded significant declines in 2008, 2011, and 2022. These historical instances suggest caution is warranted.
Tech Stocks' Critical Analogy
A remarkably important parallel is emerging in the NASDAQ that deserves close attention. This year is showing striking similarities to 2022 - not just in the topping pattern near the turn of the year, but also in how stocks rallied to those tops.

The action following both tops is also remarkably similar. The reversals were followed by larger monthly declines that were subsequently corrected on an intramonth basis. In 2022, this happened in January, while this time we're seeing it in March. As the saying goes, history doesn't repeat exactly, but it often rhymes.
The implication here is significant: regardless of the shape of the current pause or correction, the larger move ahead is likely to be downward. In 2022, many mining and commodity-related stocks saw their prices cut in half from their intraday tops to bottoms - a sobering reminder of what can happen when technical patterns align with fundamental pressures.
Dollar's Quiet but Critical Signal
The US Dollar Index has moved back above its 61.8% Fibonacci retracement level. While this move was relatively small, it represents a potentially important technical development. Fibonacci retracement levels often provide critical support and resistance points that can signal major trend changes when broken.

If the dollar continues strengthening, it could put significant pressure on precious metals prices in the coming weeks.
Economic Data Paints Mixed Picture
Today's economic data provided limited clarity. Housing data showed a 4.2% increase in existing home sales, but prices hit a record high at $398,400, marking the 20th consecutive month of year-over-year price increases.
Initial jobless claims came in at 223,000, showing only a marginal increase from the previous week, indicating continued labor market resilience despite mounting concerns about economic growth.
Connecting the Dots: A Potential Market Inflection Point
When we connect these various market signals, a coherent picture emerges that warrants attention:
- Gold is struggling at the psychologically important $3,000 level despite multiple attempts
- Mining stocks failing to confirm gold's new highs
- Copper is potentially forming a double-top pattern
- The Dollar Index showing signs of technical strength
- Fed projections pointing toward stagflationary pressures
These factors combined suggest we may be approaching a significant inflection point in precious metals markets, similar to patterns observed in 2011.
For investors holding substantial gold and mining positions, these technical signals warrant careful consideration of risk management strategies. While precious metals often perform well during periods of economic uncertainty, the historical evidence suggests markets rarely move in straight lines.
The current technical patterns in gold and related markets have historically provided important warning signals that prudent investors should consider as part of their overall strategy.
What to Watch in the Coming Days
Pay particular attention to:
- Gold's ability to maintain levels above $3,000
- Mining stock performance relative to gold prices
- Dollar Index movement around key Fibonacci levels
- Copper's behavior near its previous highs
- Market reactions to upcoming economic data releases
Thank you for reading this analysis. If you'd like to access our complete premium analysis, including specific profit-take levels (we just updated our option trade ideas), technical targets for various markets, and comprehensive portfolio allocation ideas, consider subscribing to our Gold Trading Alerts. For now, you can stay updated with our free analyses by signing up for our free gold newsletter today.
Thank you.
Przemyslaw K. Radomski, CFA
Founder, Editor-in-chief